Analytics
Find out where your edge actually lives
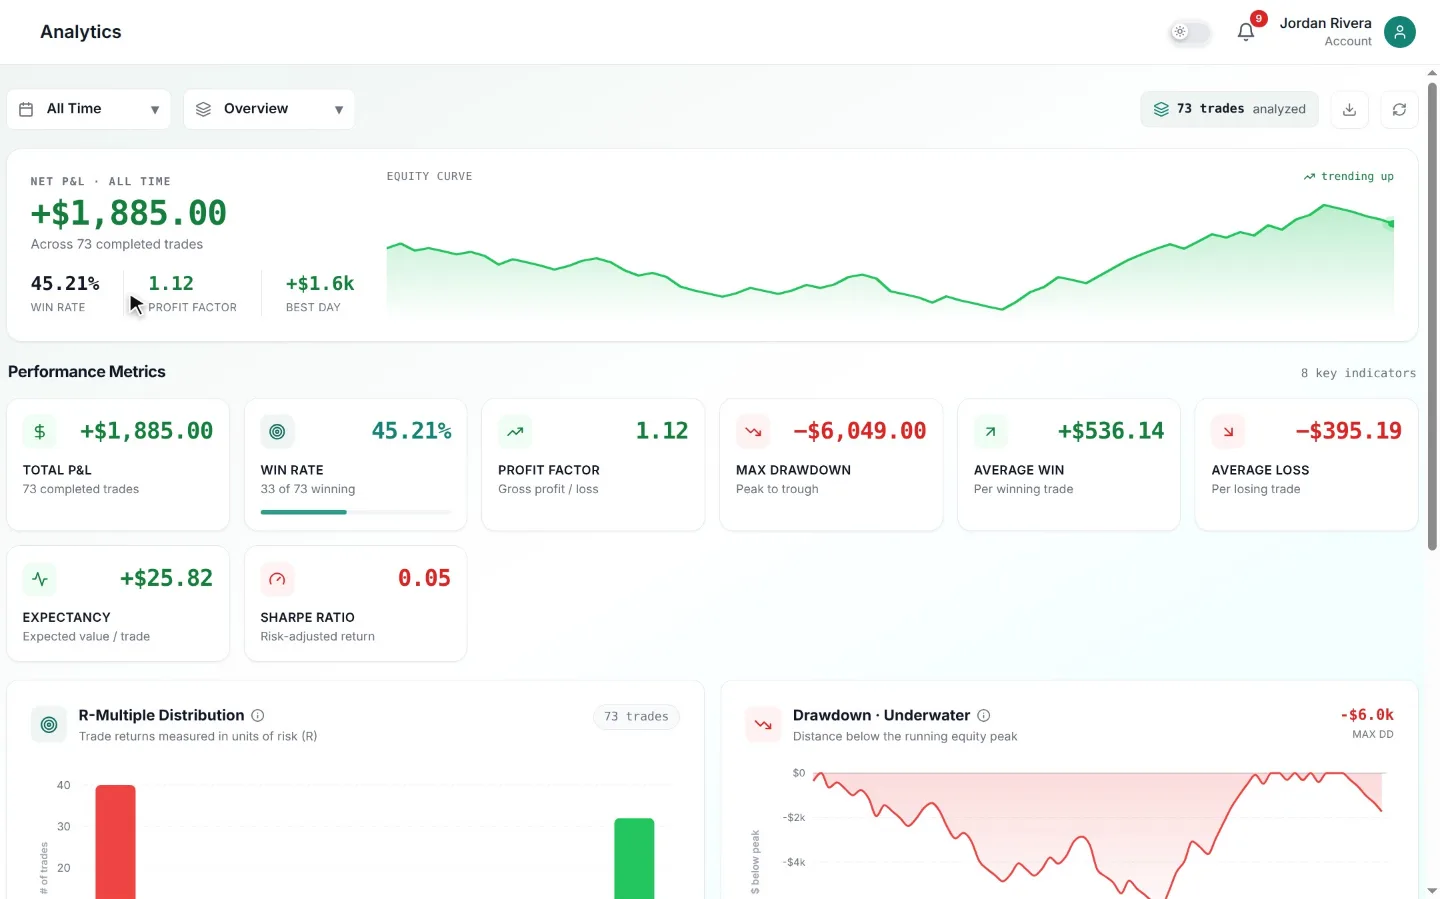
Aggregate stats hide the truth. Advanced reports slice your performance by strategy, instrument, session, and hour — so you can double down on what works and cut what doesn't.
Your P&L is an average of very different trades
A flat month rarely means every trade broke even. More often, one setup earned steadily while another gave it all back — netting to zero. Until performance is separated by strategy and instrument, the winner subsidises the loser and both stay invisible.
ZalorTrade's strategy comparison puts each tagged setup side by side: trade count, win rate, profit factor, expectancy, and total P&L. The usual result is uncomfortable and valuable — most traders discover one or two setups carry the entire account.
Time analysis: when you trade matters
Markets have personalities by hour: the open trends, lunch chops, the close squeezes. Time analysis maps your results onto that clock, showing your P&L and win rate by hour of day and day of week.
A pattern traders often describe is a session that goes well before 11am and gives ground back after lunch out of boredom. Seeing that in your own numbers is what turns "I should stop trading the dead hours" from a hunch into a decision you can act on.
Distribution tells you about risk, not just return
The R-multiple distribution chart shows the shape of your outcomes: are wins clustered at +1R with a long tail of -3R disasters, or small controlled losses with occasional +4R runners? Two traders with identical total P&L can have wildly different distributions — and only one of them is safe to size up.
FAQ
Common questions
Keep exploring
Related tools
Stop guessing. Start journaling with an edge.
Turn scattered notes into a measurable, repeatable process. Start with a 7-day free trial and keep it only if it pays for itself.