Tools
Prove it before you trade it
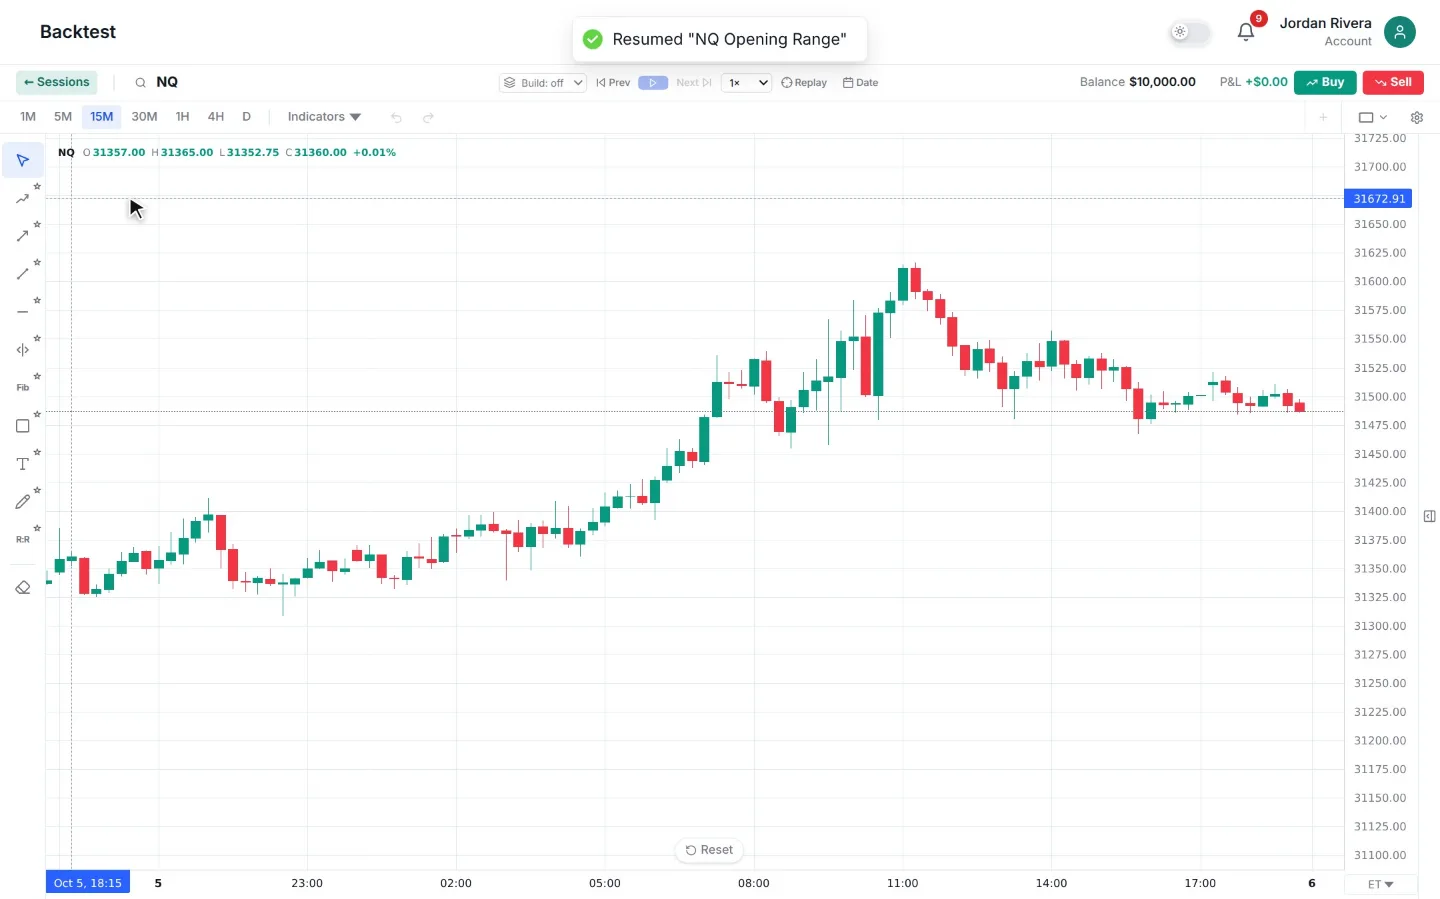
The backtesting studio replays real historical price action bar by bar. Practise your setup, place simulated trades, and get honest statistics — before a cent is at risk.
Why replay beats eyeballing old charts
Scrolling back on a chart to 'check' a strategy is self-deception: you can see the right edge, so every setup looks obvious. Bar-by-bar replay hides the future. You see exactly what you would have seen live, decide, commit, and then find out — the same psychological loop as real trading, without the account damage.
Twenty replayed trades teach you more about a setup than two hundred imagined ones, because they include the hesitation, the fakeouts, and the losses that hindsight edits out.
Backtests measured like live trades
Simulated trades flow into the same analytics engine as your live journal: win rate, profit factor, expectancy, R-distribution. That gives you a like-for-like comparison — if your live expectancy runs far below your backtest, the strategy isn't broken; the execution is, and the journal will show you where.
Sessions save automatically, so you can build a hundred-trade sample across evenings instead of one marathon.
How it works
Up and running in minutes
Pick market & date
Choose an instrument and a historical period to replay.
Trade the replay
Step through bars, mark up the chart, and place simulated entries, stops, and targets.
Read the stats
Review expectancy, win rate, and R-distribution before deciding to trade it live.
FAQ
Common questions
Keep exploring
Related tools
Stop guessing. Start journaling with an edge.
Turn scattered notes into a measurable, repeatable process. Start with a 7-day free trial and keep it only if it pays for itself.