Analytics
Know your numbers, always
Every metric a serious trader tracks — win rate, profit factor, expectancy, drawdown, Sharpe — computed automatically from your journal and live on one dashboard.
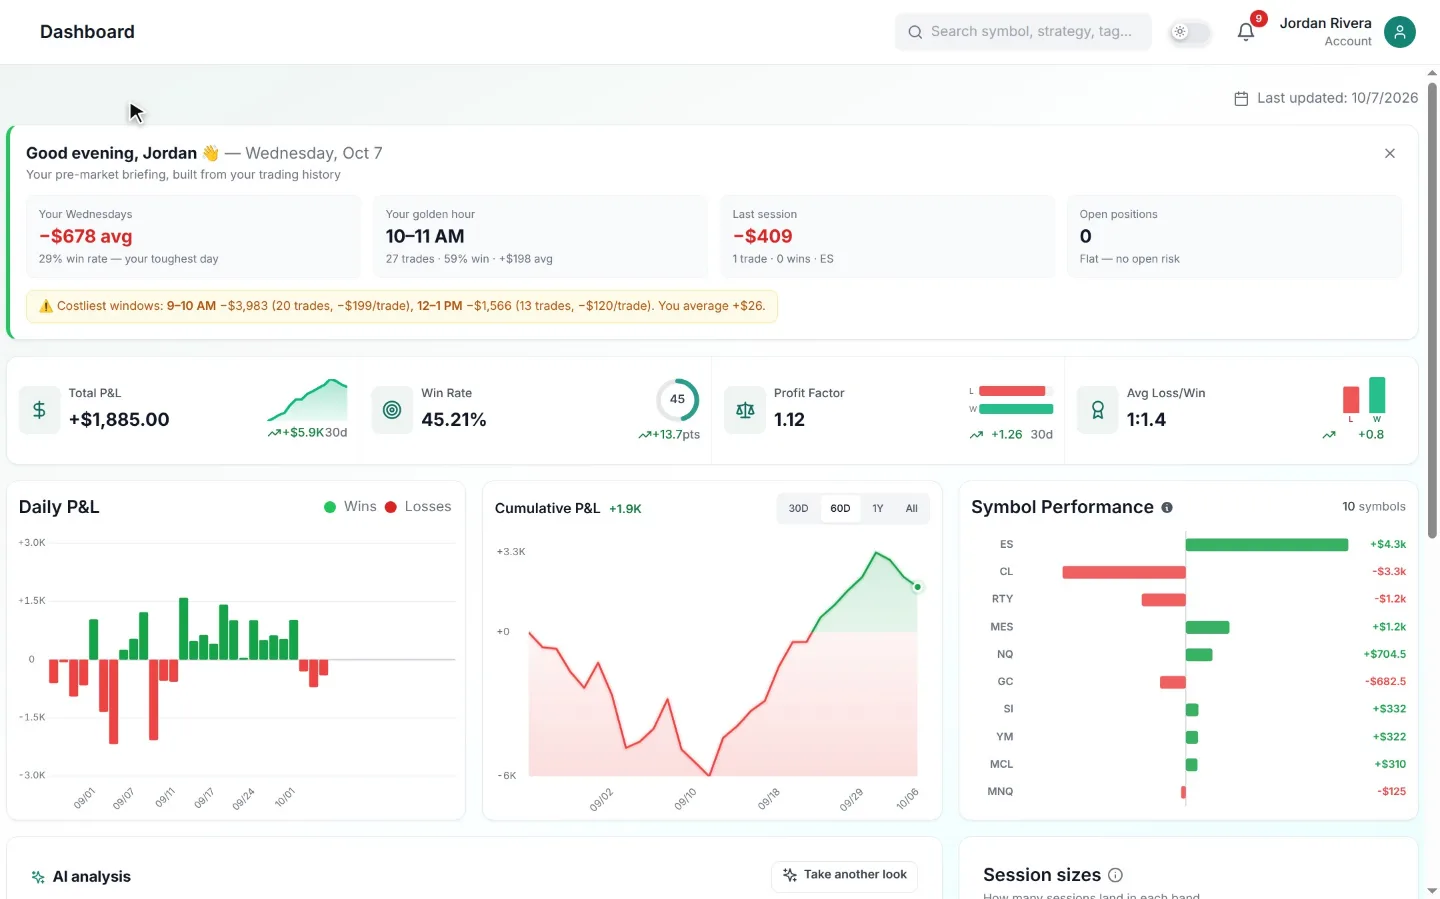
The four numbers that define your edge
Win rate alone is a vanity metric — a 90% win rate loses money if the occasional loss is ten times the average win. The numbers that matter together are win rate, profit factor (gross profit ÷ gross loss), expectancy (average result per trade in R), and maximum drawdown. ZalorTrade computes all four continuously.
Expectancy is the one to watch: it expresses your average result per trade in R, so a negative reading is a warning the last good week does not cancel. Trading involves substantial risk of loss, and no metric — expectancy included — makes a future result predictable.
Your equity curve tells the truth
The equity curve is the most honest chart in trading: it shows your account over time with every decision priced in. A rising curve with shallow drawdowns means a repeatable process. A jagged curve with deep valleys means position sizing or discipline problems — even if the end point is green.
ZalorTrade draws it live from your journal, so after every session you see exactly what that day did to the shape of your curve.
Numbers you can act on, not just admire
Every stat filters by account, strategy, instrument, and date range. That turns 'my win rate is 54%' into 'my pullback setup wins 63% in the morning session but 38% in the afternoon' — which is a decision, not a statistic.
FAQ
Common questions
Keep exploring
Related tools
Stop guessing. Start journaling with an edge.
Turn scattered notes into a measurable, repeatable process. Start with a 7-day free trial and keep it only if it pays for itself.