Journal & Tracking
Your month, at a glance
The trade calendar lays your P&L over the days you traded — green for profit, red for loss — so streaks, tilt days, and overtrading jump off the screen.
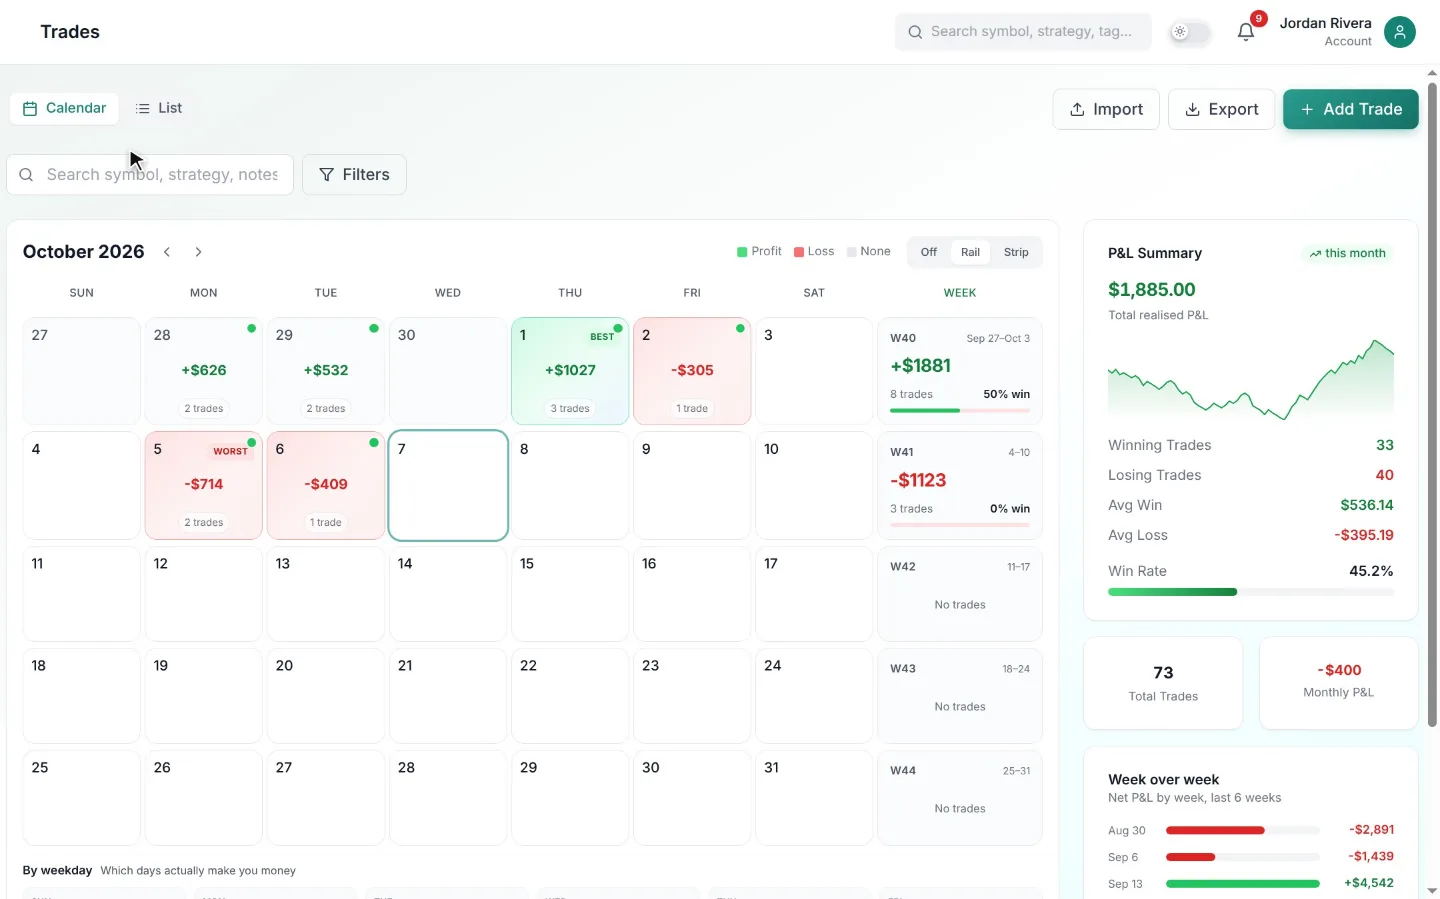
Patterns you can only see on a calendar
Some of the most expensive habits in trading are invisible in a trade list but obvious on a calendar. Three red days in a row followed by an oversized green day is revenge trading. Consistent Monday losses might mean you're trading the open without a weekend plan. A green first week and a give-back second week suggests confidence cycles.
Because each day is coloured by net P&L and shows the trade count, one glance answers questions that would take an hour in a spreadsheet: When do I lose? Do losing days cluster? Do I trade more when I'm losing?
From overview to detail in one click
The calendar is a navigation layer for your journal, not just a picture. Click any day to open a detail view with every trade taken: instrument, setup tag, R-multiple, and your notes. It's the natural flow for a weekend review — scan the month, open the days that stand out, and read what you were thinking.
Daily totals roll up into weekly and monthly summaries, so you can judge a week without mentally summing numbers, and see whether the month's result came from process or from one outlier day.
FAQ
Common questions
Keep exploring
Related tools
Stop guessing. Start journaling with an edge.
Turn scattered notes into a measurable, repeatable process. Start with a 7-day free trial and keep it only if it pays for itself.